.png) |
What is plot3 MatLab?
The plot of MatLab which we have already discussed on this site is two-dimensional. That means this normal plot in MatLab has two axes. For better and clear visualization of plots in MatLab and MatLab provides another plot function that works with three-dimensional space. This function name is plot3(). Generally, it takes three parameters as input to make a 3D plot using plot3 MatLab.The plot function is used to draw something like a circle or line or to show function values.
The plot3(x,y,z) MatLab function draws a line in three dimensions across the points whose coordinates are the elements of x, y, and z, where x, y, and z are three vectors of equal length. So, it is clear that the x, y, and z axes elements have the same size of points to plot a 3D plot using plot3 MatLab.
Plot3(x1,y1,z1,s1,x2,y2,z2,s2,x3,y3,z3,s3,... xn, yn, zn, sn) MatLab function is the basic format, where xn, yn, and zn are vectors or matrices, and sn are strings specifying color, marker symbol, line style, label or x-axis, y-axis, and z-axis variables. These strings are identical to those used in two-dimensional charts.
Plot3(table, x_variables, y_vairables, z_variables) MatLab function used to plot a group of data in three-dimension space. If you want to visualize multiple data sets, specify multiple variables for at least one of the arguments. Arguments with multiple variables must have the same amount of variables.
Plot a 3D function using plot3 MatLab
% Length of vector x
x= linspace(-10,0.1,10);

% Assigning x vector in t vector
% Length of vector y must be same as x
y= x;

% z is the function of both x and y vector
z= -2.*x.^3+x+3.*y.^2 + 6.*x.*y;
plot3(x,y,z);
Output figure
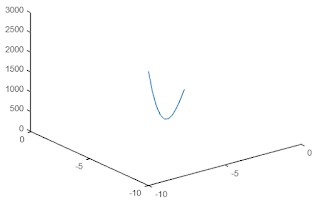 |
| plot3 MatLab to plot a function |
We have seen the three axes and the function has been plotted in axes. We can turn on the grid mode to understand the 3D plot in a 3D space. Add the below line to this code.
grid on;Output figure
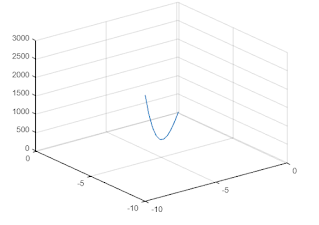 |
| plot3 Matlab with the grid to plot a function |
Now, the figure has better look but can't recognize the axes. For this, we can add the label of each axis.
xlabel('x-axis');
ylabel('y-axis');
zlabel('z-axis');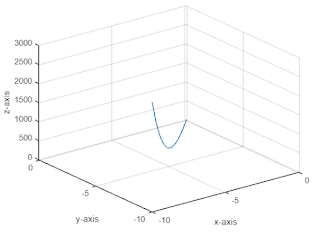 |
| plot3 MatLab to plot a function with axes name |
Plot a group of data from a table using plot3 MatLab in 3D graphs
% define range of the table vectors
t = (0:pi/10:20*pi)';

% define x vector
x = sin(t);

% define y vector
y = cos(t);

% assign x and y vector to make table
tbl = table(x,y,t);

% the head() will help you to see table data
head(tbl,3);

% plot3 matlab to plot 3D lines
p = plot3(tbl,"x","y","t");

% define the style properties of the graph
% width of the plotted line
p.LineWidth=2;
% line style
p.LineStyle='--';
% line color
p.Color='green';
% line marker
p.Marker='o';
Output figure
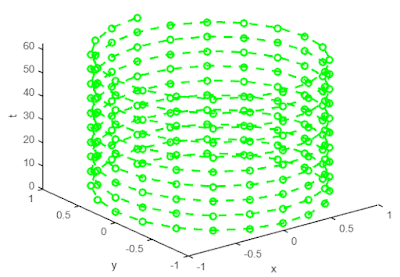 |
| plot3 MatLab to plot a table data |
Plot multiple lines using plot3 MatLab to make a 3D mesh ball
% length of the lines
t = 0:pi/1000:pi;

% First curve line
xt1 = sin(t).*cos(10*t);
yt1 = sin(t).*sin(10*t);
zt1 = cos(t);

% Second curve line
xt2 = sin(t).*cos(20*t);
yt2 = sin(t).*sin(20*t);
zt2 = cos(t);

% Third curve line
xt3 = sin(t).*cos(30*t);
yt3 = sin(t).*sin(30*t);
zt3 = cos(t);

% Fourth curve line
xt4 = sin(t).*cos(40*t);
yt4 = sin(t).*sin(40*t);
zt4 = cos(t);

% Fifth curve line
xt5 = sin(t).*cos(50*t);
yt5 = sin(t).*sin(50*t);
zt5 = cos(t);

% Plotting all axes in one plot
plot3(xt1,yt1,zt1,xt2,yt2,zt2,xt3,yt3,zt3,xt4,yt4,zt4,xt5,yt5,zt5);
% Define the labels
xlabel('x-axis');
ylabel('y-axis');
zlabel('z-axis');
grid on;
Output Figure:
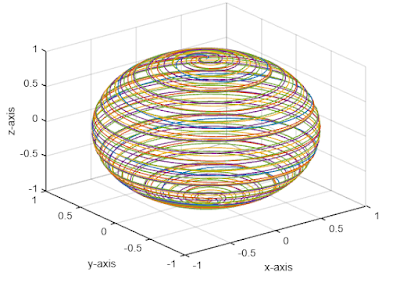 |
| 3D mesh ball using plot3 MatLab |
This multiple lines 3D mesh is made from one line mesh. We merged five curve lines by maintaining proper distance using the sine and cosine curves. Here is a look at a curve line.
t = 0:pi/1000:pi;
xt1 = sin(t).*cos(10*t);
yt1 = sin(t).*sin(10*t);
zt1 = cos(t);
Call the plot3 function, and specify consecutive XYZ triplets.
plot3(xt1,yt1,zt1);
xlabel('x-axis');
ylabel('y-axis');
zlabel('z-axis');
grid on;
Output Figure:
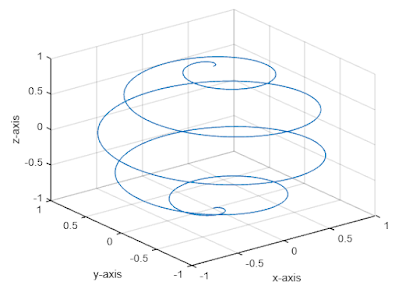 |
| A curve line that is generated from sine and cosine curve |