In this post, we are going to discuss how to plot a circle in MatLab. Before, reading this post we want to suggest you read the whole post carefully because this post not only teaches you about to plot a circle in MatLab but also you will learn about the basic knowledge in terms of 'circle'. We will present a different approach to plot a circle in MatLab along with its easier approach that needs less time and less coding implementation. Discussion topics,
First, the basic knowledge about the circle (formulas, definition) will be discussed broadly.
Secondly, different approaches will be presented with codes and proper discussion. You need to be good knowledge of geometry and that is why this section is added.
The famous Bresenham's circle will be implemented in MatLab
Some recommended videos from youtube that will enrich your knowledge.
A gentle introduction to a Circle
What is a Circle?
You are thinking about a circle? No, you are imagining a 360-degree curve line. The line follows curvature nature with some points.
A circle is a 360-degree shape object that is the combination of some points following a particular distance (radius) corresponding to its center.
In another view of point, we can say that a circle is a curve shape object. So, to plot a circle you have to rotate some set of points at a particular distance. Let us introduce some equations of circles.
Equation of a circle
1. The traditional equation of a circle
From, the trigonometric, we know the basic formula of a circle and that is,
(x-a)2 +
(y-b)2 = r2 -------------(1)
This is the equation of an ideal circle where (a, b) is the center coordinates and r is the radius for the (x, y) points.
2. A point circle or a zero circle
If the values of (a, b), i.e.: the center coordinates are zero, then the circle equation will be,
x2 + y2
= r2 --------------------(2)
This is the equation of a point circle or a zero circle or a point. A point circle or zero circle is a circle where the coordinate of the center is zero.
3. Parametric equation form of a circle
Before starting this sub-section, we have to learn the sine and cosine trigonometric functions. The sine and cosine are the angle functions from the trigonometric mathematical part. As we mentioned before, a circle is a 360-degree object shape. A 360 degree is an angle. so, if we want to draw a circle, we can draw by drawing angles again and again. That is why we are learning these sine and cosine angles. But why only sine and cosine angles? The sine and cosine angles are related to the parametric form of a circle's equation. Also, these two angles make it easy to plot a circle as they are performing calculations with the opposite and adjacent respect to the hypotenuse of an angle.
The sine function is the ratio of opposite and hypotenuse of an angle. As well, cosine is the ratio of adjacent and hypotenuse. Ratios are,
sin(t) = opposite / hypotenuse
cos(t) = adjacent / hypotenuse
A circle drawing process using sine and cosine is shown in the below animation. We hope, that will clear the statement "Drawing a circle using sine and cosine angle".
 |
| Plot a circle using sine and cosine waves. src: Wikipedia |
The discussion of sine and cosine functions has been ended. Now, we want to focus on the parametric equation of a circle. The first equation can be written in a new form called 'parametric form' using the trigonometric angle's functions sine and cosine. Stated as below,
x = a + rcos(t)
y = b + rsin(t) ------------------(4)
Here, (x, y) are set of all points, (a, b) are the center points, r is the radius, and t is the parametric variable in the range of ("0 to 2pi" or "0 to 360").
Again, from the trigonometric we know that,
cos(t) = (1-t2) / ((1+t2)
sin(t) = (2t) / ((1+t2)
So, we can write an alternative eqation of the parametric form of circle,
x = a + r (1-t2) / ((1+t2)
y = b + r (2t) / ((1+t2) ------------------(5)
4. Rectangle form
This form is only possible in the coding and implementation using a programming or scripting language. A rectangle has four 90 degrees angles. If we curve these 90-degree angles by a particular curve value, then it will turn into a circle. This approach needs less time to plot a circle in coding, especially in MatLab coding.
 |
| Rectangle to Circle Transformation |
Plot a circle in MatLab in different approaches
The explanation part has been ended. Now, we will plot circles in MatLab using the above approaches. In the web, the parametric and rectangle form to plot a circle are used. So, we will implement these two approaches in MatLab one by one.
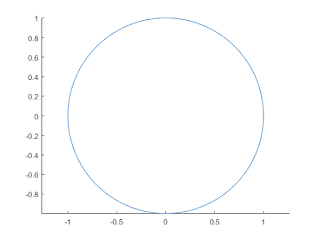
Plot a circle in MatLab using Parametric form
Code
% Taking a range 0 to 360 with 100 steps
t = linspace(0,2*pi,100);

% This is the centre point of a circle (a, b)=(0, 0)
a=0;b=0;

% Assigning sine and cosine function to plot a circle
x = a + r*sin(t);
y = b + r*cos(t);

% Plot the circle using the (x, y) set of points
line(x,y)

% Bounding the circle in the graph
axis equal
Output
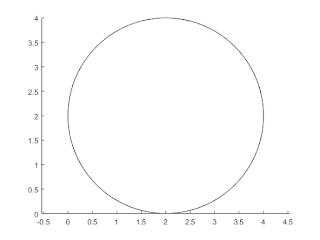
Plot a circle in MatLab using Rectangle form
Code
% define the radius of the plotted circle
r = 2;

% Centre of the circle is (a, b) = (2,2)
c = [2 2];

% Here, 2r is the diameter of the circle
positions = [c-r 2*r 2*r];

% Using the rectangle() built-in function of MatLab
rectangle('Position',positions,'Curvature',[1 1])

% Axis should be equal or it will plot an ellipse
axis equal
Output
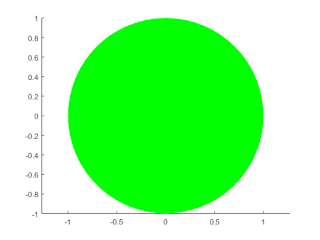
Plot a filled circle in MatLab using Rectangle form
Code
% Assigning the radius of a circle
r = 1;

% Using the rectangle() built-in function of MatLab
% You can change the line pattern with edge color
rectangle('position',[0-r,0-r,r*2,r*2],'curvature',[1,1],'FaceColor', 'green', 'Edgecolor','none');

% Bounding the circle in a graph
axis equal
Output
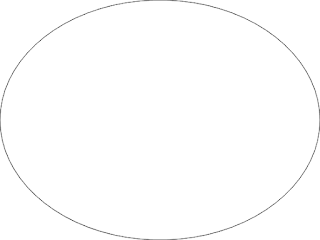
Plot an ellipse in MatLab using Rectangle form
Code
% center of the circle
center = [2, 2];

% radius of the circle
r = 1;

% possition of the circle [[x,y], width height]
pos = [center-2, r r];

% annotation process to draw an ellipse
annotation('ellipse', pos );
Output
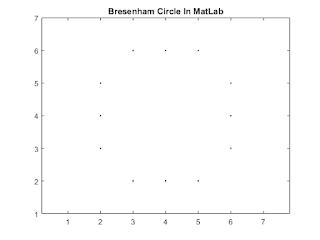
Plot the Bresenham Circle Drawing algorithm in MatLab
We have already discussed the Bresenham circle drawing algorithm for computer graphics. The c++ and python implementation has been attached to this post.
Code
% The Bresenham Circle Algorithm
function bres_circle(a,b,r)
% Take input for x, y, radius, and incremental step
a = input('X:  ');
b = input('Y: ');
r = input('Radius: ');
inc = input('Increment steps[Default:1]: ');
% Set up the default increment steps value
if isempty(inc)
    inc =1;
end

% Intialize the x and y for the algorithm
x = 0;
y = r;
% Set up the distance value
d= 3-2*r;

% Generate the set of (x, y) points
while(x < y)
   plot_bres_cir(a,b,x,y,r);
   if d>=0
      d = d +4*(x-y)+10;
      x = x + 1/inc;
      y = y - 1/inc;
   else
      d = d + 4*x +6;
      x = x+1/inc;
   end
end

% plot the Bresenham Circle Algorihtm
function plot_bres_cir(a,b,p,q,r)
for i= -1:2:1
   for j= -1:2:1
        % k mean 'key' and the key color is black
      plot(a+i*p,b+j*q,'k.');
        plot(a+i*q,b+j*p,'k.');
        % we do not need the grid
      grid off
      hold on
   end
end
title('Bresenham Circle In MatLab')
axis([a-r-1 a+r+1 b-r-1 b+r+1])
axis equal;
Input
X: 4
Y: 4
Radius: 2
Increment steps[Default:1]: 1
.png)
