Histogram equalization without using imhist() in MatLab
% Read the input image
I=imread('leaf.PNG');

% If it is a color image
% Then, turn it into a grayscale image
I=rgb2gray(I);

% Calculate the height and width of the image
[height,width]=size(I);

% Compute the number of occurrences of each gray level
NumPixel = zeros(1,256);
for i = 1:height
    for j = 1:width
        % occurrences in the image
        NumPixel( I(i,j) + 1 ) = NumPixel( I(i,j) + 1 ) + 1;
    end
end

% plot bar with the intensity value of the image
bar(NumPixel)
% set title of the image
title('Histogram of input Image');
% print the Pixels
fprintf('Number of Pixel of the Image\n')
fprintf('%f\n',NumPixel)
Input Image:
 |
| Input Image for testing (leaf.PNG) |
Output Image:
 |
| Histogram of the above image |
Revised repository source: https://github.com/CHAAAAA/
Histogram equalization using imhist() in MatLab
% Read the input image
I=imread('leaf.PNG');
% If it is a color image
% Then, turn it into a grayscale image
I=rgb2gray(I);

figure
% Sub-ploting the original image
subplot(1,2,1)
imshow(I)
% Sub-ploting the output image
subplot(1,2,2)

% The imhist() calculate and display the grayscale plot
imhist(I,64)
Output Image:
 |
| Histogram equalization of an image using imhist() |
Revised repository source: https://www.mathworks.com/help/images/histogram-equalization.html
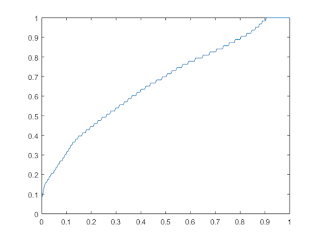
Shows pixels number of Histogram equalization in a curve plot MatLab
% Read the input image
I=imread('leaf.PNG');
% If it is a color image
% Then, turn it into a grayscale image
I=rgb2gray(I);

% The histeq() returns two parameter
[J,T] = histeq(I);
figure
plot((0:255)/255,T);
Output Image:
 |
| Histogram Equalization of an image in a Curve |
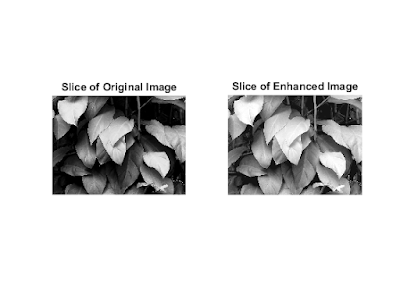
Image enhancing using histogram equalization
% Read the input image
I=imread('leaf.PNG');
% If it is a color image
% Then, turn it into a grayscale image
I=rgb2gray(I);

enhanced = histeq(I);
figure
% Sub-ploting the original gray image
subplot(1,2,1)
imshow(I(:,:,1))
title('Slice of Original Image')
% Sub-ploting the resultant image
subplot(1,2,2)
imshow(enhanced(:,:,1))
title('Slice of Enhanced Image')
Output Image:
 |
| Image Enhancing using Matlab |
Revised repository source: https://www.mathworks.com/help/images/ref/histeq.html
What is Histogram?
A histogram is a graphical representation that organizes a group of data points into user-specified ranges.
source: https://www.investopedia.com/terms/h/histogram.asp
What is histogram equalization?
Histogram equalization is a method in image processing of contrast adjustment using the image's histogram.
Source: https://en.wikipedia.org/wiki/Histogram_equalization
How to do Histogram equalization?
Histogram equalization can be done in three steps:
- Compute the histogram of the image.
- Calculate the normalized sum of the histogram.
- Transform the input image to an output image.
Source: https://people.ece.ubc.ca/irenek/techpaps/introip/manual02.html
Referenced Videos:
1. Basics of Histogram
2. Basics of Histogram Equalization
3. Histogram equalization without built-in function | MATLAB
Tags:
Matlab